


 6-7 / 60

6
SG 11/2012
T R E N D S
D
er Anstieg der Süßwaren-Umsätze
im deutschen Handel resultiert in
erster Linie aus den Preissteigerungen
der Anbieter. Gemäß dem aktuellen
Süßwarenmonitor von IRI stiegen die
Erlöse in den ersten vier Monaten des
laufenden Jahres um 3,3 Prozent auf
3,747 Mrd. Euro, während sich das
Absatzvolumen im Vergleich zur
Vorjahresperiode leicht um 0,4 Pro-
zent auf 526.490 Tonnen reduzierte
(Basis: LEH + Drogeriemärkte + Hard-
Discount + Tankstellen).
Das umsatzbedeutendste Segment
Schokoladenwaren (ohne Saison) lag
Umsatzplus dank Preissteigerungen
mit 1,631 Mrd. Euro um 3,7 Prozent
über dem Soll, während die verkaufte
Menge an Süßwaren um 1,9 Prozent
auf 171.540 Tonnen zurückging. Die
mit Salzigen Snacks erzielten Umsätze
stiegen im Zeitraum von Januar bis
April sogar um 6,4 Prozent auf
854,2 Mio. Euro bei einemAbsatzplus
von 3,9 Prozent auf 114.062 Tonnen.
Die Kategorie Süßgebäck & Kuchen
bewegte sich in etwa auf Vorjahres-
niveau mit einem Umsatzanstieg um
0,4 Prozent auf 640,5 Mio. Euro und
einem Absatzrückgang um 0,8 Pro-
zent auf 127.614 Tonnen. Die Erlöse
mit Zuckerwaren erhöhen sich um
1,3 Prozent auf 621,2 Mio. Euro bei
einem um 1,6 Prozent gesunkenen
Volumen von 113.274 Tonnen. Weiter
rückläufig entwickelte sich das Kau-
gummi-Segment mit einem Umsatz
von 153,9 Mio. Euro (- 6,2 %) bei
109,1 Mio. Stück (- 5,5 %). Zufrieden-
stellend verlief das Geschäft mit
Saisonartikeln zu Ostern 2015: Der
Umsatz von 449 Mio. Euro bedeutete
einen Zuwachs von 4,4 Prozent bei
einem um 1,8 Prozent gesteigerten
Volumen von 35.170 Tonnen.
•
www.iriworldwide.deSG 7 5
T
he rise in confectionery turnover
on the German retail market
is primarily attributable to price
increases. According to the current
IRI confectionery monitor, revenues
in the first four months of 2015
increased by 3.3% up to € 3.747 bn,
while sales volume declined slightly
in comparison to the same period last
year by 0.4%down to 526,490 tonnes
(basis: food retailers + drug stores +
hard discounters +gas station shops).
Chocolate products (not counting
IRI: turnover boost through price increases
seasonal products) are the strongest
selling segment and exceeded their
target by 3.7% with € 1.631 bn, while
the quantity of chocolate products
sold dropped by 1.9% down to
171,540 tonnes. Sales of salty snacks
rose during the period from January
to April by 6.4% up to € 854.2 m
with a sales volume boost of 3.9%
up to 114,062 tonnes.
The category of sweet pastries and
cakes remained relatively consistent
at the previous year‘s level with a turn-
over increase of 0.4% up to € 640.5 m
and a sales decline of 0.8% down to
127,614 tonnes. Sugar confectionery
revenues increased by 1.3% up to
€ 621.2 m with a volume decline of
1.6% down to 113,274 tonnes. The
chewing gum segment continued
its decline with sales of € 153.9 m
(- 6.2 %) at 109.1 million units (- 5.5 %).
The 2015 Easter season articles busi-
ness was satisfactory with sales of
€ 449 m (+ 4.4%) and a 1.8% volume
increase up to 35,170 tonnes.
•
Copyright ©2015 Information Resources, Inc. (IRI). Confidential and Proprietary.
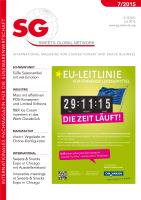
1
IRI Süßwarenmonitor: Absatz / Umsatz / Veränderungsraten
Januar-April 2014 vs. 2015, Basis: Deutschland (LEH + DM + HD + Tankstellen)
2014
2015
2014
2015
SÜSSWARE (ex Kaug., ex Saison)
528.477
526.490
-0,4
3.627,4
3.747,0
3,3
Schokowaren ex Saison
174.820
171.540
-1,9
1.573,2
1.631,1
3,7
Tafelschokolade1)
62.554
58.488
-6,5
451,9
474,0
4,9
100g -Segment
36.985
35.301
-4,6
269,1
284,9
5,9
Großtafel
21.796
19.751
-9,4
143,1
150,0
4,8
Kleintafel
3.773
3.435
-9,0
39,7
39,2
-1,3
Pralinen1)
37.656
36.793
-2,3
465,6
468,2
0,6
Pralinenspezialitäten
29.252
28.420
-2,8
343,7
341,5
-0,6
Alkoholpralinen
5.693
5.515
-3,1
66,7
64,6
-3,1
Pralinenmischungen
2.711
2.859
5,4
55,2
62,1
12,5
Riegel1)
47.407
47.741
0,7
393,1
409,1
4,1
SmallBites 1)
14.242
14.577
2,4
102,4
110,1
7,5
gekühlteRiegel1)
10.751
11.695
8,8
86,1
93,8
8,9
Überraschungen1)
2.210
2.246
1,6
74,0
75,7
2,3
Salzige Snacks 4)
109.830
114.062
3,9
803,1
854,2
6,4
Süßgebäck & Kuchen
128.701
127.614
-0,8
637,7
640,5
0,4
Süßgebäck 3)
79.550
79.790
0,3
415,6
418,9
0,8
Kuchen/Torte2)
49.151
47.824
-2,7
222,2
221,6
-0,2
Zuckerwaren Gesamt
115.125
113.274
-1,6
613,4
621,2
1,3
Fruchtgummi/SZ/Lakritz4)
72.481
70.971
-2,1
298,3
299,0
0,2
Bonbons 3)
21.183
21.498
1,5
191,3
199,1
4,1
Kaubonbons 4)
9.143
8.787
-3,9
57,0
56,3
-1,2
Sonst.Zuckerware3)
12.319
12.018
-2,4
66,8
66,8
0,1
Schaumküsse
5.834
5.720
-2,0
30,4
30,4
0,0
Puffreis
2.776
2.896
4,4
14,5
15,7
8,3
GeleeSchokoliert
2.885
2.633
-8,8
12,4
11,2
-10,0
Lutscher
427
379
-11,4
4,9
4,7
-3,7
Brause
396
390
-1,5
4,5
4,8
5,5
2013
2014
2013
2014
Saison 5)
Ostern (Feb-Mai)
34.563
35.170
1,8
430,4
449,5
4,4
Weihnachten (Sept13-Jan14 / Sept14-Jan15)
42.821
41.434
-3,2
537,0
557,0
3,7
Verk.TsdStueck
2014
2015
2014
2015
Kaugummi 4)
115.468
109.119
-5,5
164,0
153,9
-6,2
Absatz in Tonnen
Umsatz in Mio. Euro
VAE. % VJ
Sonstige Zuckerware Definition:
Schaumküsse, Gelee Schokoliert, Lutscher, Brause, Puffreis
VAE. % VJ
1) InfoScan (LEH ab 0qm + Harddiscounter + DM + Tankstellen)
2) InfoScan (LEH>200qm + Harddiscounter)
3) InfoScan (LEH>200qm + Harddiscounter + DM)
4) InfoScan (LEH>200qm + Harddiscounter + DM + Tankstellen)
5) InfoScan (LEH ab 0qm + Harddiscounter + DM)
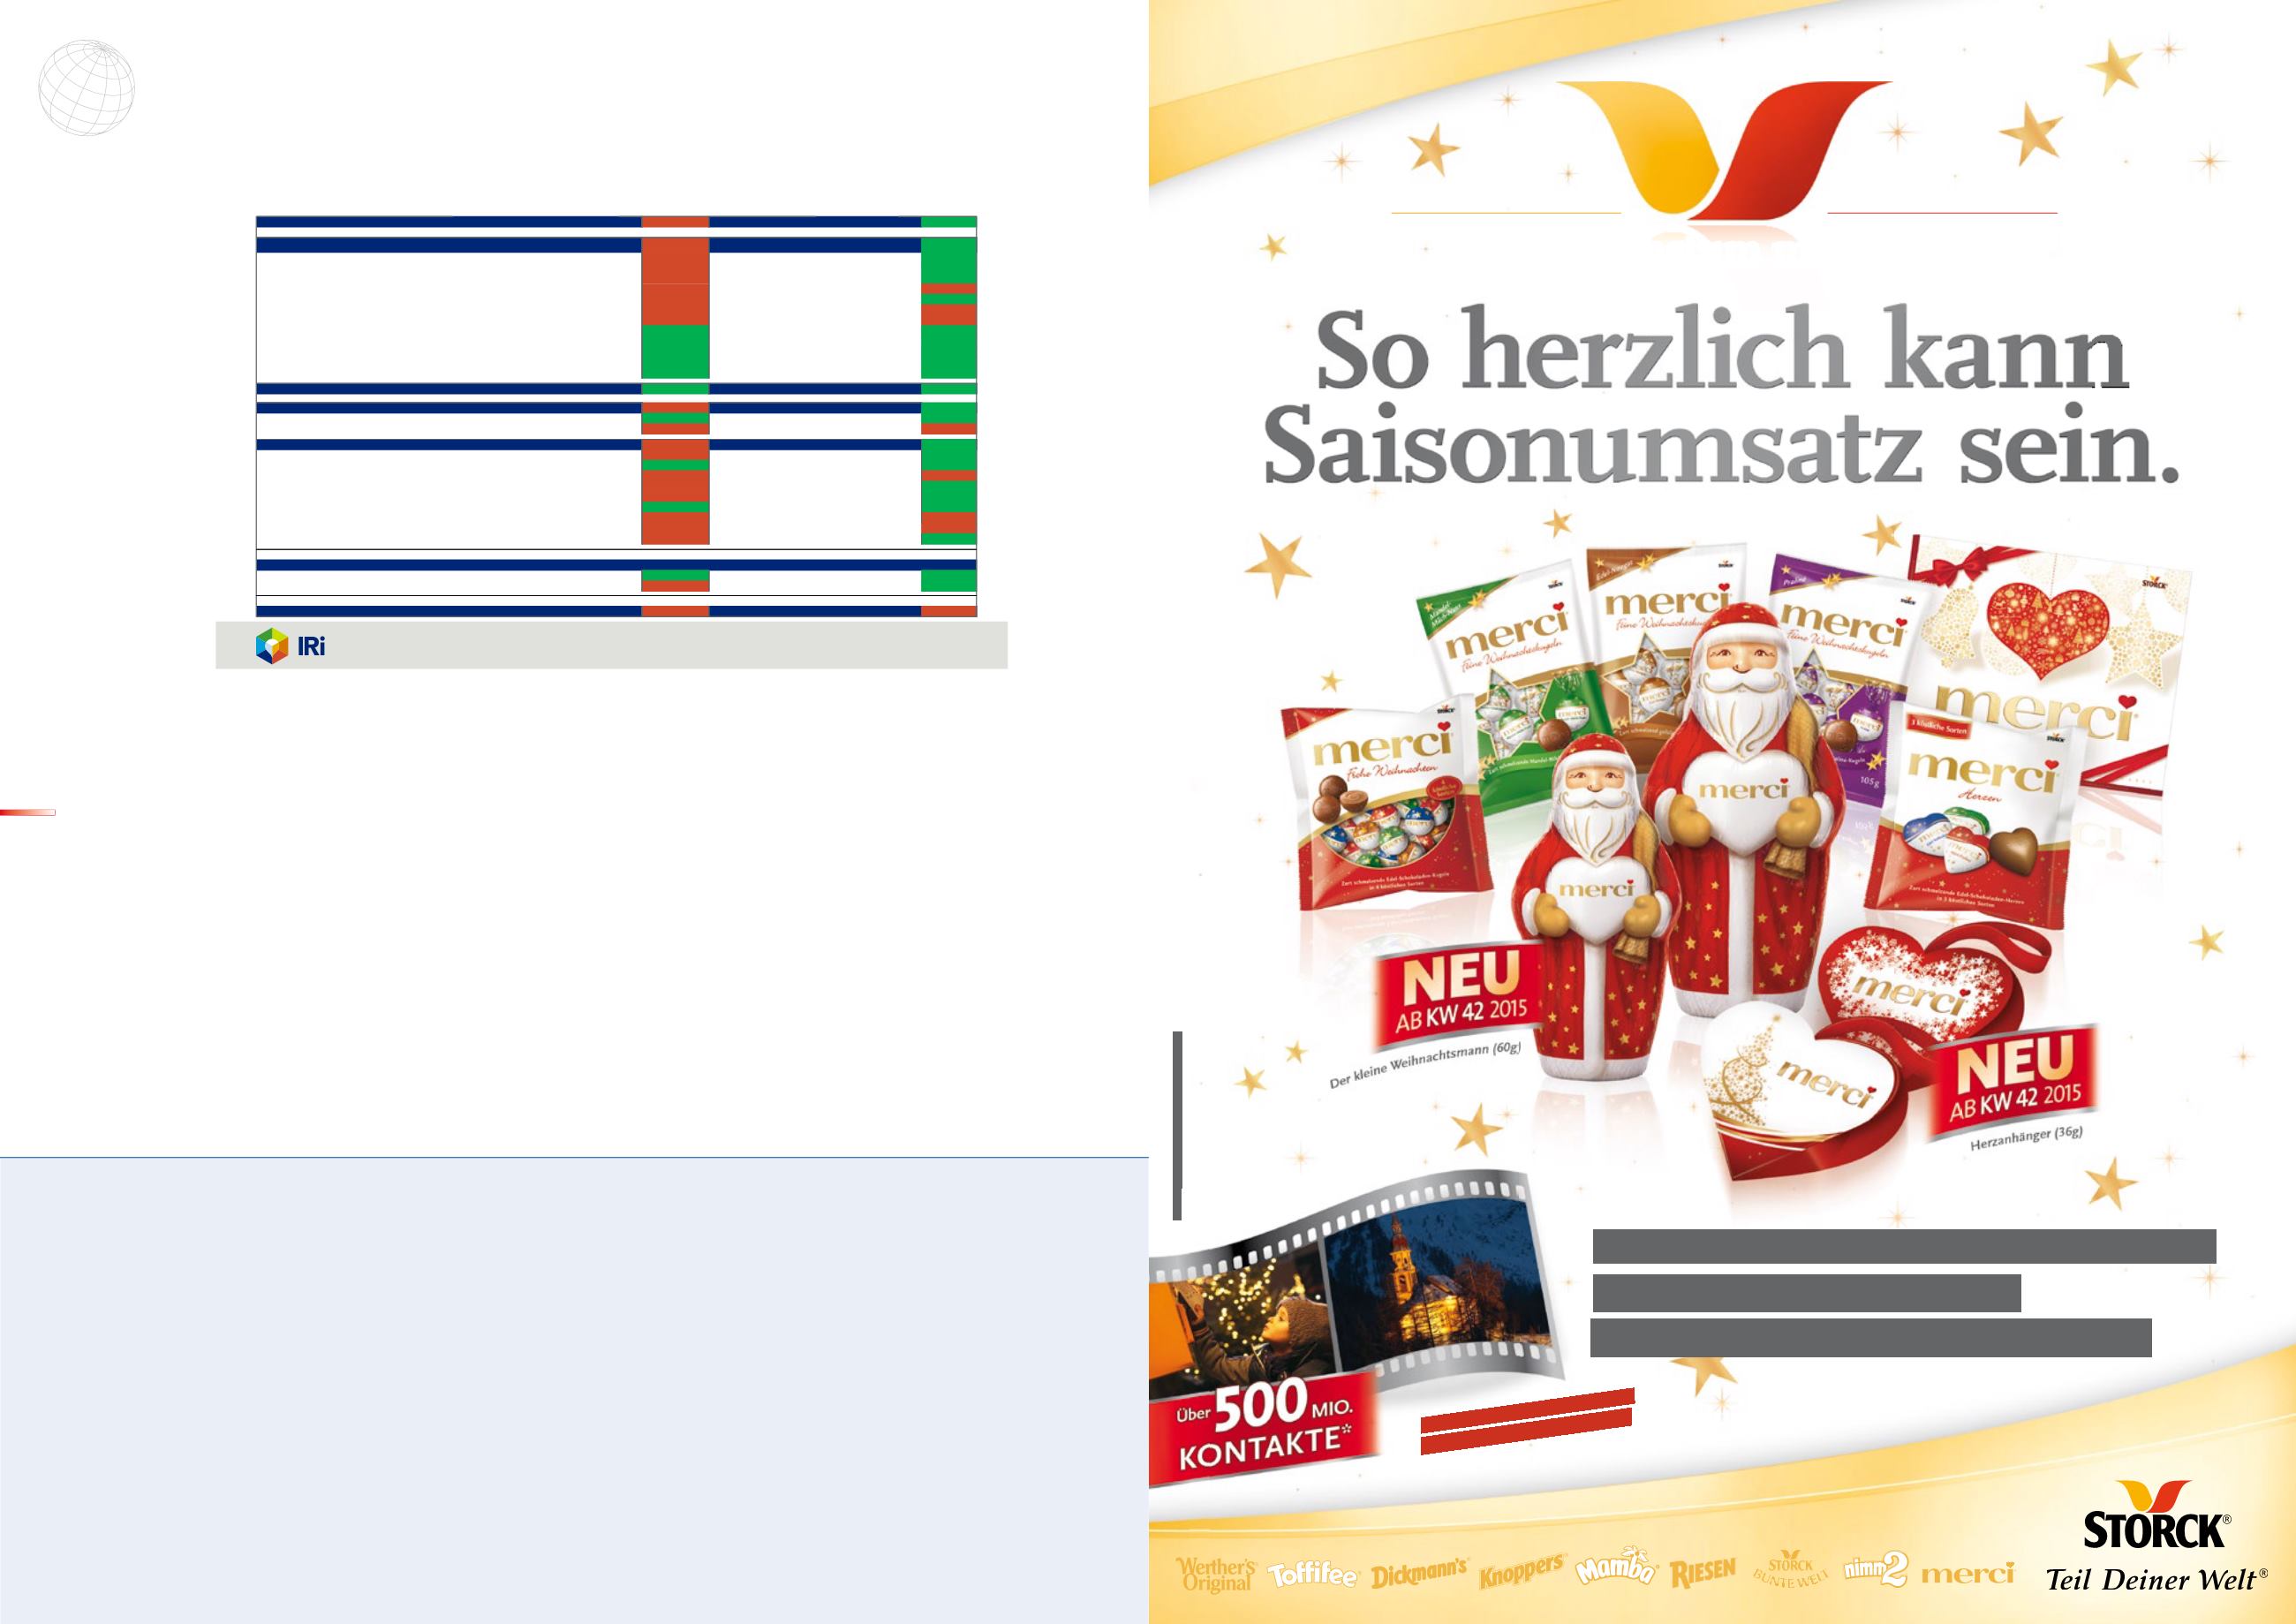
*Quelle: Bruttokontakte merci Weihnachts-Spots 2015; Zielgruppe 14+
Dekorieren, Verschenken, Verwöhnen –
merci bedient jeden Anlass
im Weihnachtsgeschäft.
STIMMUNGSVOLLE
TV-UNTERSTÜTZUNG
Markenwachstum mit Substanz